
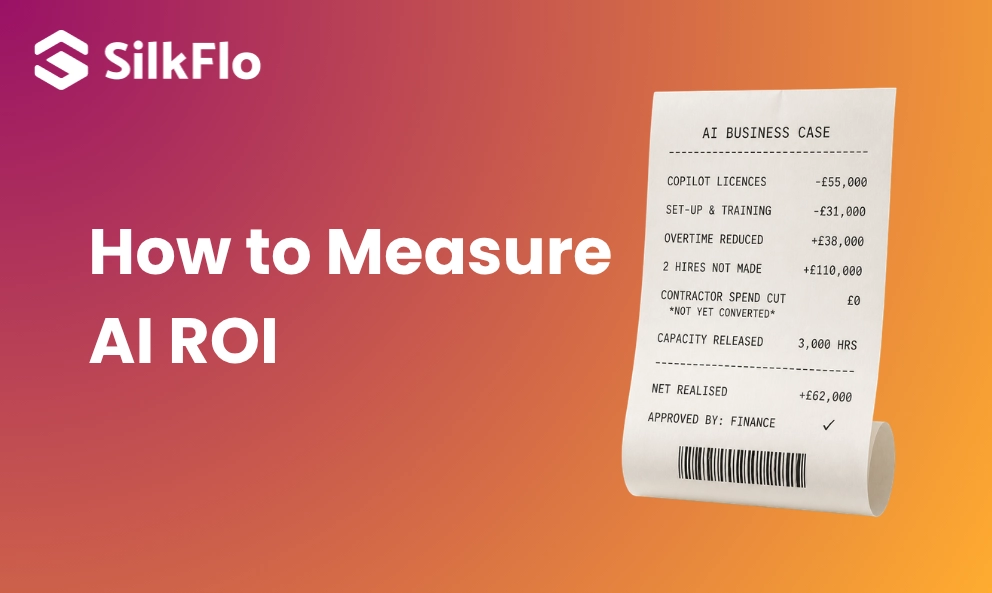
How to measure AI ROI comes down to five steps: set a baseline before you build, count the full cost of each initiative, forecast benefits with named assumptions, then log actual results monthly and compare them to the forecast. Map benefits to six value drivers: productivity and automation, cost reduction, revenue growth, customer experience, compliance and risk, and employee experience. Hours saved only count once you can show what got smaller.
Few organisations get that far. In KPMG’s Q2 2026 Global AI Pulse, a survey of 2,145 senior leaders across 20 markets, organisations with full visibility of their AI running costs were five times more likely to report established ROI than those without, at 15% against 3%. Among US finance chiefs surveyed by RGP, only 14% had seen a clear, measurable impact from AI so far. This guide sets out the five steps that close the gap and the metrics that survive a CFO’s questions. It covers the measurement half of AI value realisation, which is proving that what was funded actually paid back.
Why is AI ROI harder to measure than RPA ROI?
RPA had one value driver. A bot took over a fixed, rules-based task and the saving was the hours that task used to take, multiplied by a loaded hourly rate. Most RPA programmes could put a defensible figure on a bot within six months because the before and after were easy to see.
AI spreads its value across judgement, quality and speed, often inside work that was never timed. A claims handler using Microsoft Copilot drafts a letter faster, makes fewer errors and gets to a harder case the same afternoon, and none of that appears in a bot run log. The Cambridge Centre for Alternative Finance’s 2026 Global AI in Financial Services Report found 55% of industry respondents find AI value hard to measure, rising to 76% at large financial institutions. The fix is to stop treating AI as one number and measure each value driver separately, the same approach that works for measuring Copilot ROI.
Which metrics should we use to measure AI and automation ROI?
Tie every AI and automation initiative to one or more of six value drivers, then set the benefits against one full cost figure.
| Value driver | Example metrics | Counts as cash? |
|---|---|---|
| Productivity and automation improvement | Hours freed, items per person, cycle time | Only once it shrinks overtime, contractor spend, a backlog or a planned hire |
| Cost reduction | Contractor fees, retired licences, overtime, hires not made | Yes. Name the budget line that got smaller |
| Revenue growth | Income gained, faster cash collection, higher conversion | Yes |
| Customer experience and improvement | Response times, first-contact resolution, satisfaction, complaints | Rarely. Report against its own baseline |
| Compliance and risk mitigation | Errors caught, fraud losses prevented, audit findings closed, rework avoided | Sometimes, for avoided losses and penalties |
| Employee experience and retention | Staff turnover, time on repetitive work, engagement | Indirectly, through lower turnover cost |
Not every driver converts to cash. Report the money drivers in currency, and the rest against their own baseline. This helps the board see the full return without an inflated cashable figure.
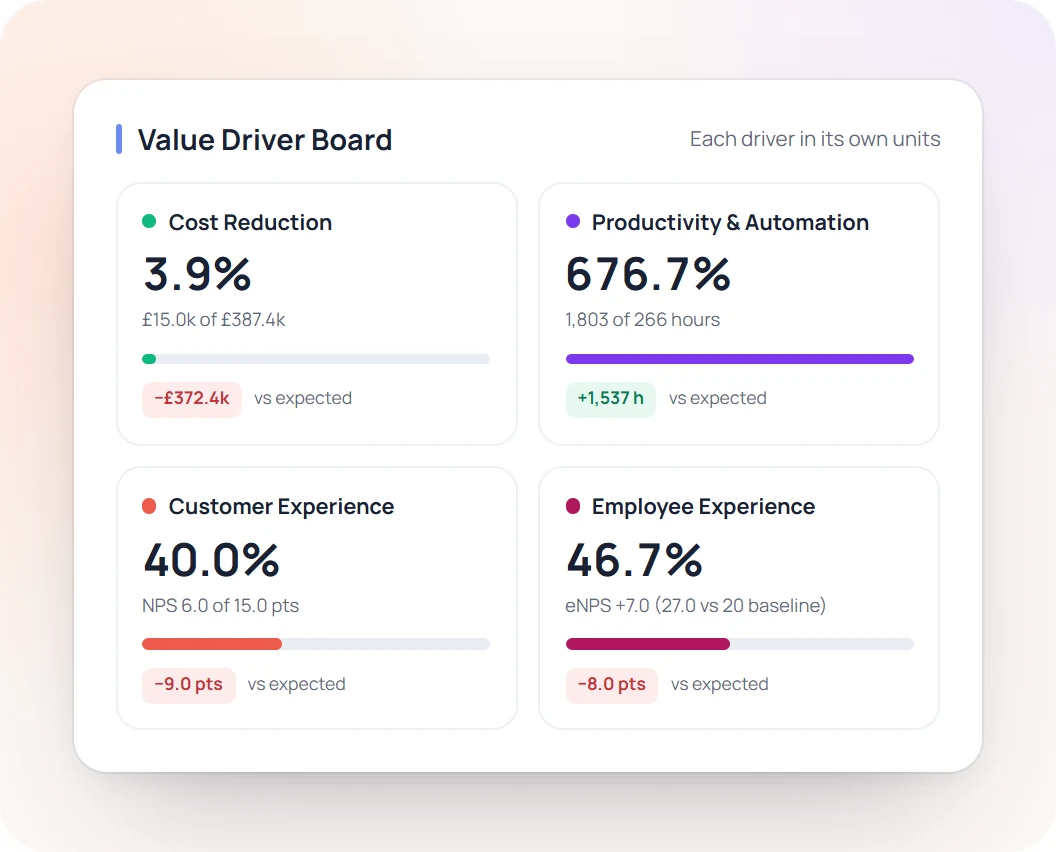
The cost side needs every line: licences, tokens and API usage, build effort, run and support costs and the internal time people spend on it. This is where most AI ROI figures fall apart. The same KPMG Pulse found 42% of leaders have only partial visibility into AI spend, which means their ROI ratio has a guess sitting underneath it.
Hours saved don’t show up in the P&L: what should we measure instead?
Measure what got smaller. Hours saved become value only when they move a number the finance team already tracks, such as FTE, overtime, contractor spend, backlog or time to cash. Until then they are a forecast.
Vendor dashboards report hours saved and active users because those numbers are easy to produce and only ever go up. They do not connect to a P&L line and finance teams know it. Coastal Cloud and Oxford Economics’ 2026 AI Operations Survey of 150 financial services firms found 45% measure AI success mainly by time saved, while 61% say AI fell short of expected ROI. Those two findings belong in the same sentence.
To test FTE reduction, write down for each initiative where the freed hours went: a role not backfilled, a hire not made, overtime stopped or a backlog cleared. If the honest answer is “absorbed into the day”, log it as capacity released with no cashable value and say so in the report. A CFO will trust a reported zero far more than an inflated hours figure.
How to measure AI ROI, step by step
These five steps apply to any AI initiative, from a single Copilot rollout to a portfolio of agents, RPA bots and document processing tools.
Step 1: Set a baseline before you build
Record the as-is position before the first sprint: volume of work, time per item, cost per item and error rate. Without a baseline, every later claim is an estimate of an estimate. In an ArvatoConnect survey of 201 UK public sector transformation decision-makers, 78% admitted they had not set KPIs for their programmes. If you have not started tracking anything, pick the few numbers the initiative is meant to move and capture a month of them now. Deciding which projects deserve a baseline comes first, and our guide on how to identify and prioritise high-impact AI projects covers that step.
Step 2: Count the full cost of each initiative
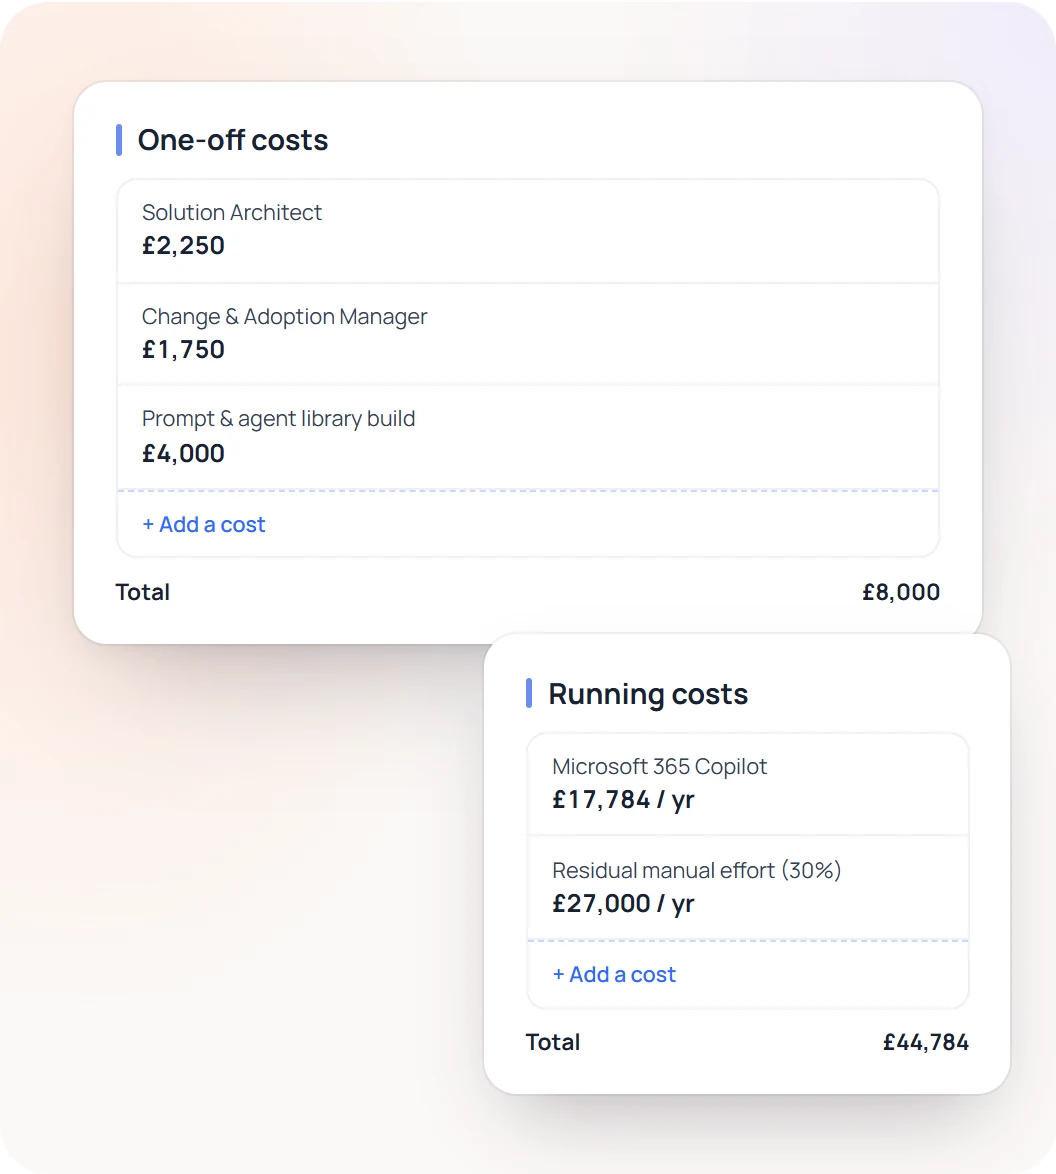
List every cost line for the life of the initiative, including run costs in years two and three. Token and API usage scales with adoption, so a pilot’s cost tells you little about the production bill. Count internal time as well. The subject matter experts who tested the prompts and the analysts who maintain the workflow cost money even when no invoice arrives.
Step 3: Forecast benefits with named assumptions
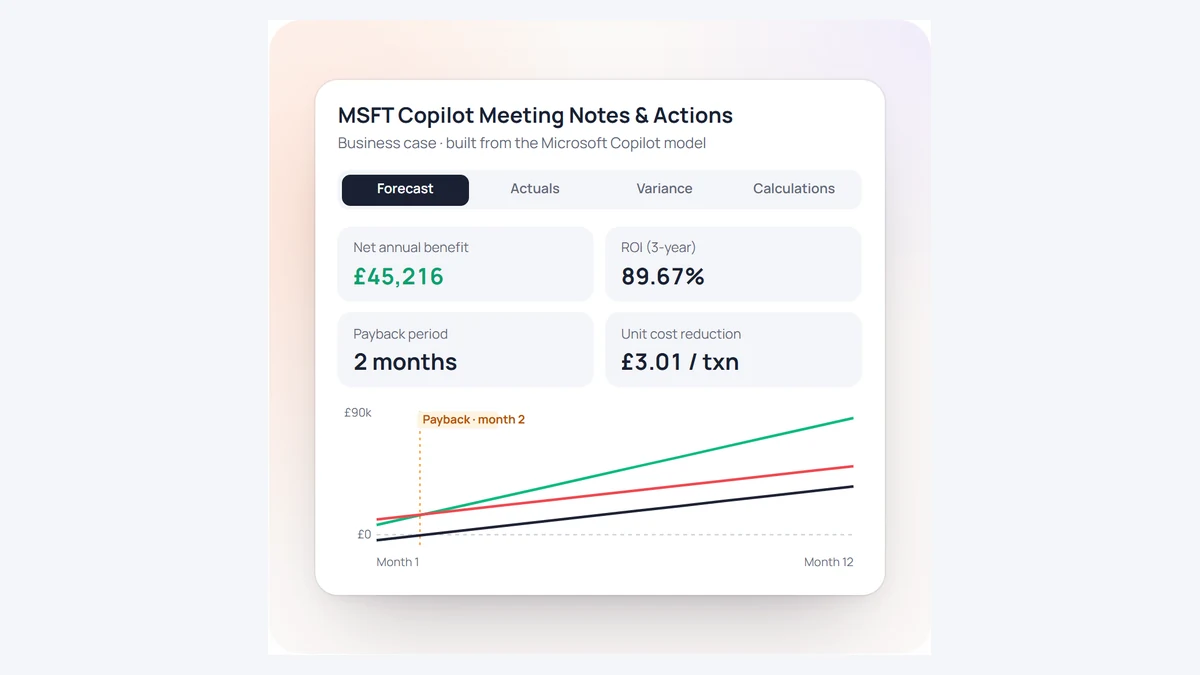
Write the forecast as assumptions someone can check later: volume per month, minutes saved per item, adoption rate, which of the six value drivers it lands in and the person who owns it. A forecast built from named assumptions can be audited, whereas a single headline figure gives an auditor nothing to test. SilkFlo’s Business Case Builder structures the forecast this way, and ready-made business case models prefill typical costs and benefits for common rollouts so the first draft takes minutes.
Step 4: Log actual results every month
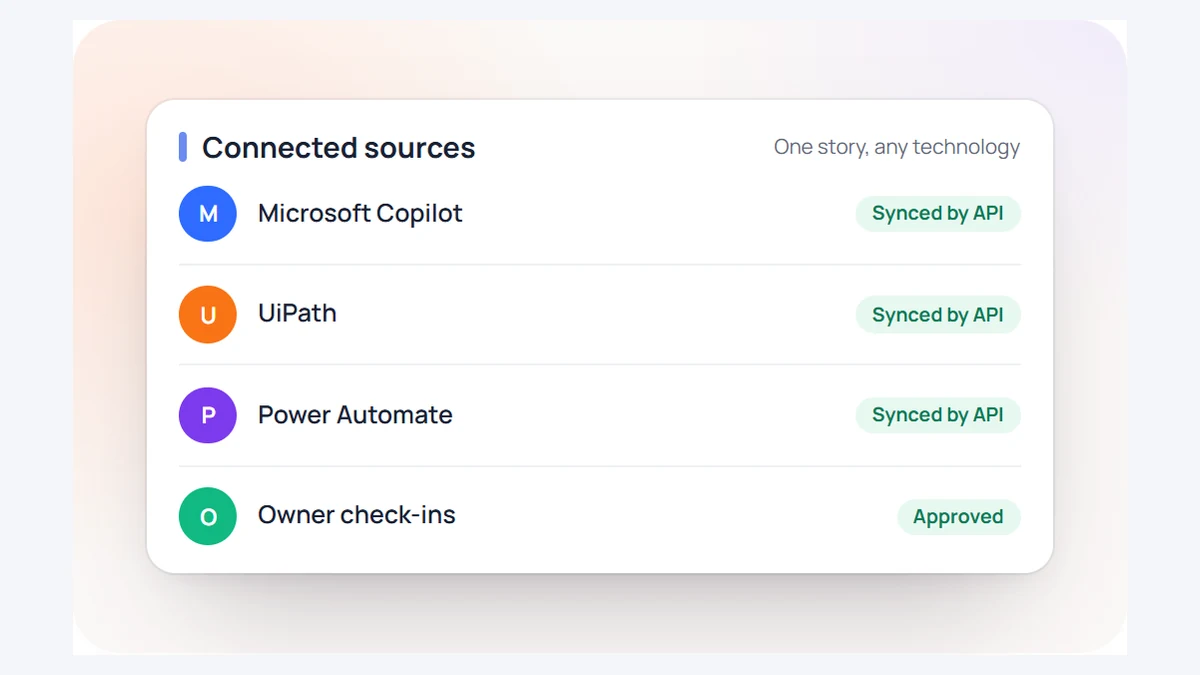
Once the initiative is live, record actuals against the same assumptions every month. This is the monthly forecast-vs-actual review, and it is the step most organisations skip because Jira and ServiceNow stop tracking once the work is marked done. SilkFlo’s benefits register captures actuals for any AI initiative, and the SilkFlo API lets teams push actuals from their own systems so the forecast against actual comparison updates itself.
Step 5: Compare forecast to realised and reallocate
Review the gap between forecast and realised value every month, in step with the finance close. A quarterly review lets a £100,000-a-month shortfall become £300,000 before anyone acts. Take realised figures from finance and HR systems, not the vendor’s dashboard. When an initiative’s gap passes an agreed threshold, decide which case it is:
- Delayed: value is arriving later than forecast. Move the date, keep the target.
- Overstated: the forecast was wrong. Restate the business case and check it still clears the hurdle rate.
- Not converting: the tool works, but freed hours are not reaching a budget line. Redeploy the time, cut the spend or stop the planned hire.
Then scale what is beating its business case, fix what is close and stop what is not delivering. Gartner’s 2026 survey of more than 1,300 leaders, reported by CIO Dive, found that organisations that track ROI constantly, manage AI as a portfolio and stop underperforming initiatives reported positive returns on 81% of their AI initiatives. To test a single initiative before it reaches a review, run the numbers through the free AI ROI calculator.
The AI ROI formula, with a worked example
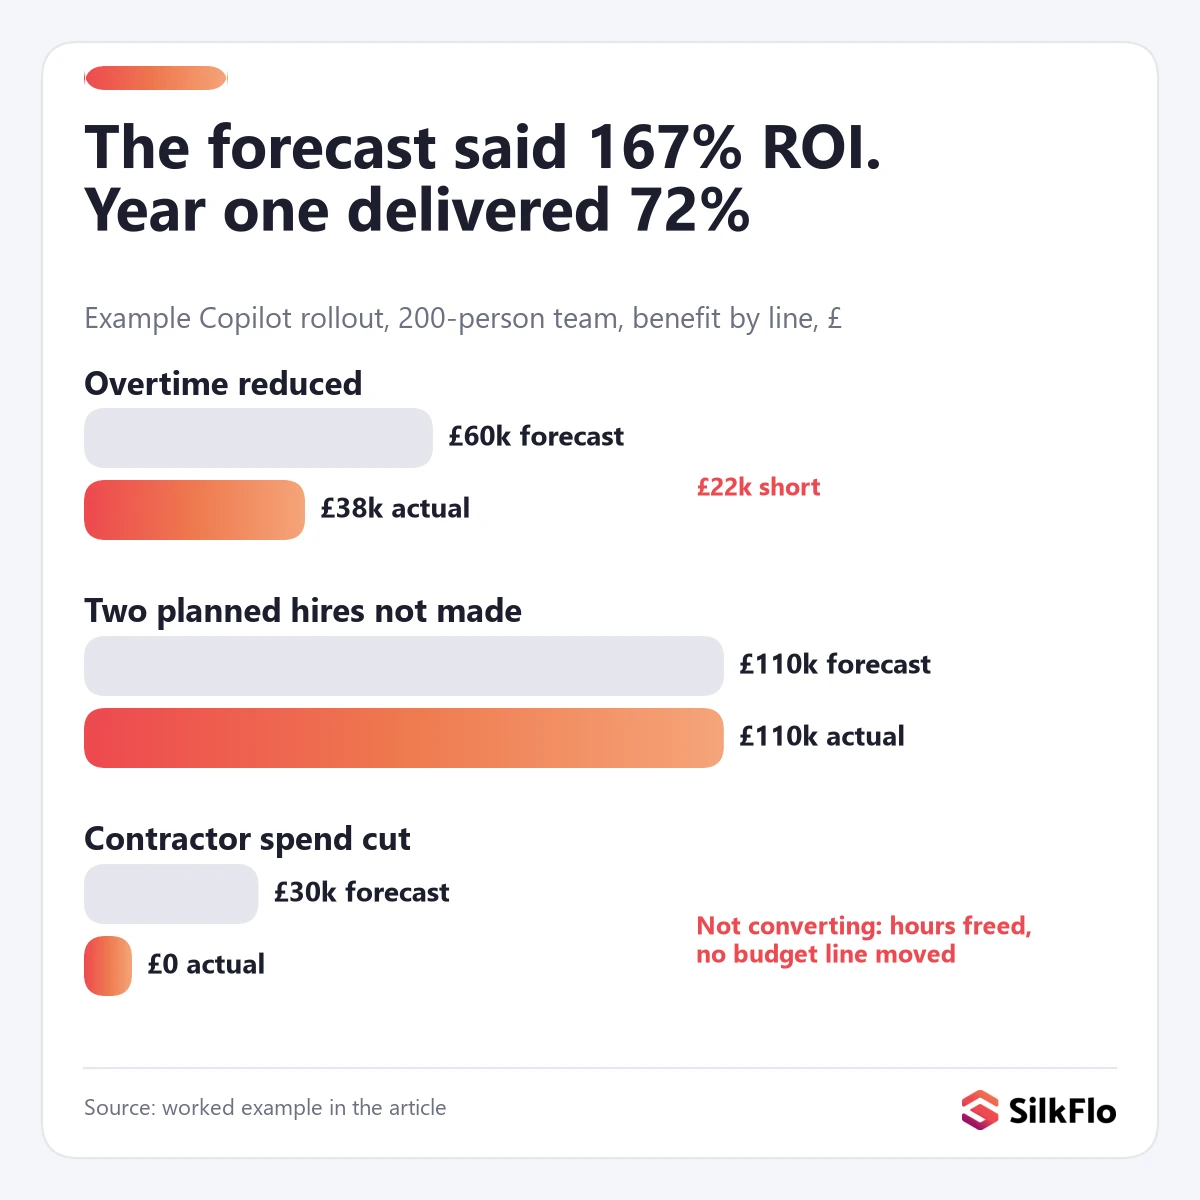
AI ROI is (total benefit minus total cost) divided by total cost, over a set period, usually three years. Payback is total cost divided by monthly net benefit. The work is in getting honest figures for each line. Take a Copilot rollout for a 200-person operations team, measured over its first year.
| Line | Forecast | Actual (year 1) | Source |
|---|---|---|---|
| Licences | £55,000 | £55,000 | Finance ledger |
| Set-up, training and support time | £20,000 | £31,000 | Timesheets |
| Total cost | £75,000 | £86,000 | |
| Overtime reduced | £60,000 | £38,000 | Payroll |
| Two planned hires not made | £110,000 | £110,000 | Approved workforce plan |
| Contractor spend cut | £30,000 | £0 | Not yet converted |
| Total benefit | £200,000 | £148,000 | |
| ROI | 167% | 72% |
The actual is still a good return, but it is well under half the forecast ROI. The contractor line shows hours were freed but never reached a budget line, which is the “not converting” case in step 5. Without the table, the team would have reported the forecast. You can run your own numbers through the free AI ROI calculator.
We’ve only got two or three AI projects off the ground. Is it too early to start tracking value?
No. It is the cheapest moment to start. With two or three initiatives, a baseline takes a day and the forecast-vs-actual habit forms before the portfolio grows. Waiting until there are twenty means rebuilding baselines nobody captured and arguing about numbers from memory. Start with one register, one owner per benefit and a monthly review, and add initiatives as they arrive.
How can a business analyst with no access to finance data still produce ROI figures?
Work from operational data and agreed unit costs. A business analyst can usually get volumes, handling times and error rates from the case or workflow system. Ask finance once for a standard loaded cost per hour for each role and a unit cost for common activities, then apply them consistently. Mark the result as an operational estimate, and ask finance to confirm the cashable lines (overtime, contractors, hires) each quarter. That gives the CFO a figure built on agreed rates rather than guesses.
How do we show what an AI team costs against what it returns?
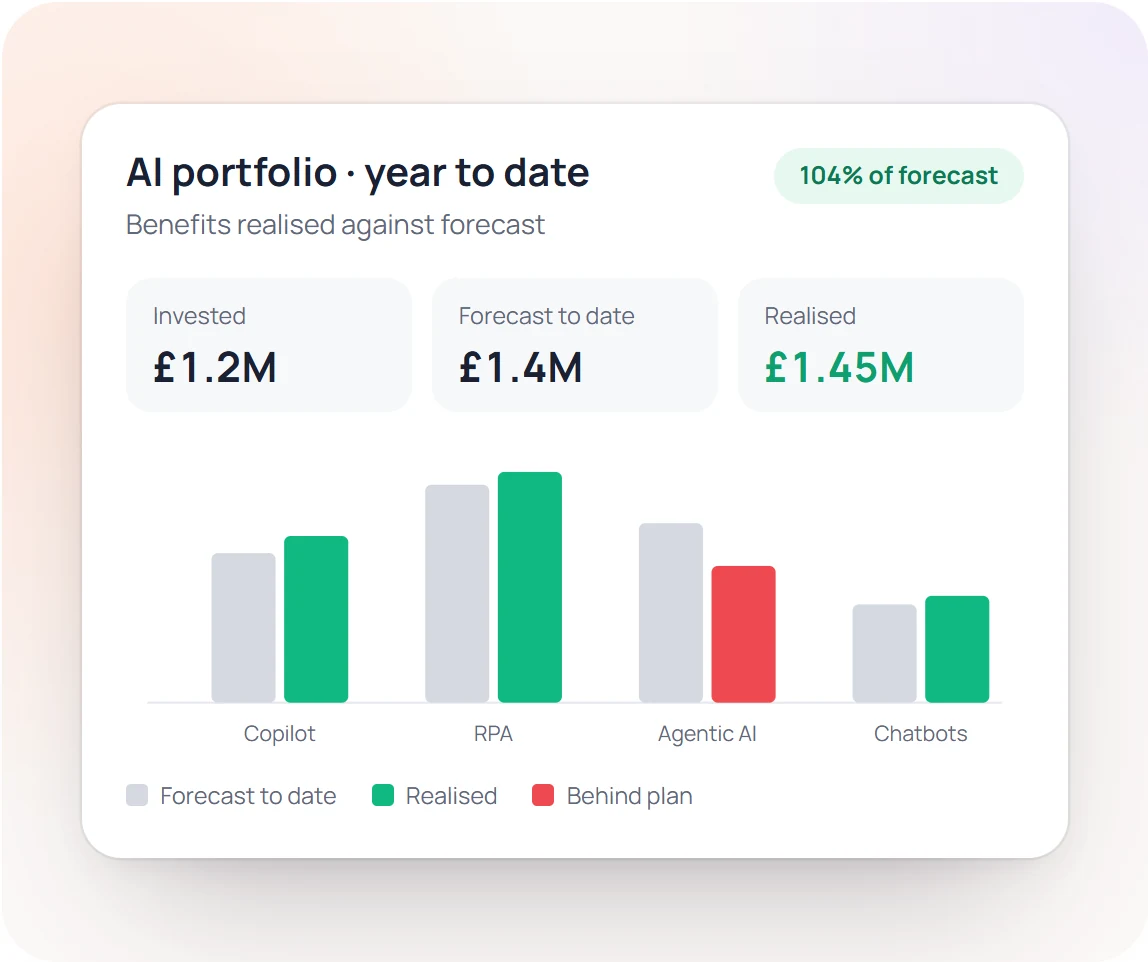
Put the team’s full cost and every initiative it has delivered on one page, with forecast value, realised value to date and cost for each. That turns a headcount debate into an investment review. An AI team that cannot produce this view becomes a cost line in the next budget round, however good its work has been. CloudZero’s 2026 report Finding the ROI of AI: The Finance Perspective, a survey of 260 senior finance professionals, found 87% say they need to tie AI spend to business results within the next year, while only 22% can do so today.
Start by checking how mature your measurement is with the AI ROI Maturity Assessment, then build the view initiative by initiative. In SilkFlo, the pipeline summary tiles show portfolio value across every initiative in one place. Our page on AI ROI for finance leaders covers how the finance team uses that view.
Who should own AI ROI measurement?
The CFO and CIO should own it jointly, with the existing AI council or centre of excellence doing the work. The CIO knows what was built and what it costs to run. The CFO decides what counts as a benefit and which budget line got smaller. Neither can sign off the number alone.
Gartner calls this kind of body an AI Central Bank: a group that sets AI governance policy, validates cost and risk, and allocates resources on ROI, with the CIO and CFO taking turns in the chair. Most organisations already have the start of one in an AI council or CoE. What it usually lacks is the economics: one view of forecast against realised value for every initiative. That gap is common. In a 2024 Gartner survey of more than 700 IT leaders, nearly half said proving AI’s value was a top barrier to rolling it out.
How is AI ROI measured in the public sector?
Public sector bodies split value into cashable and non-cashable savings. Cashable savings leave the budget and can be redeployed or returned. Non-cashable savings, usually capacity released, improve service without reducing spend, so report the two separately or the cashable figure gets inflated. The five steps above apply unchanged, with every benefit tagged as one or the other. Our framework for cashable and non-cashable savings in councils shows how councils report capacity released without overstating it.
What does this look like in practice?
Aviva UK’s Claims Innovation team used SilkFlo to qualify 102 opportunities in three weeks, identifying £12M in savings opportunities. The work cost £865 in SilkFlo against £75,600 for a traditional consulting approach, roughly 87 times lower. Every opportunity entered the portfolio with a costed business case and named assumptions, which is what makes the later forecast against realised comparison possible.
SilkFlo is the AI Value Realization Platform built for this. Every AI and automation initiative, from a Copilot rollout to an RPA estate, is tracked against the business case it was approved on, with cashable savings kept apart from capacity released and results pulled from the tools you already run. Staffordshire County Council tracks UiPath, Power Automate and Microsoft Copilot in one place. To size one initiative first, use the free AI ROI calculator, or book a SilkFlo demo to see your own portfolio.
Frequently Asked Questions
How to measure AI ROI
What costs should be included when measuring AI ROI?
Every line for the life of the initiative: licences, tokens and API usage, build effort, run and support costs in years two and three, and the internal time of the experts and analysts who test and maintain it. Token and API usage grows with adoption, so a pilot’s cost tells you little about the production bill.
How often should we review AI ROI?
Monthly, in step with the finance close. A quarterly review lets a £100,000-a-month shortfall become £300,000 before anyone acts.
We haven’t started tracking any metrics. How do we set a baseline before we build?
Pick the few numbers the initiative is meant to move, usually volume, time per item, cost per item and error rate, and capture one month of them before the build starts. Record who owns each number.
Can vendor dashboards prove the ROI of an AI tool?
No. They report active users and hours saved, which show use, not value, and do not connect to a P&L line. Take realised figures from your finance and HR systems instead.
What should we do when an AI initiative falls short of its forecast?
Work out which case it is. If value is arriving late, move the date and keep the target. If the forecast was wrong, restate the business case and check it still clears the hurdle rate. If the tool works but freed hours are not reaching a budget line, redeploy the time, cut the spend or stop the planned hire.