

According to Boston Consulting Group, 60% of companies fail to capture measurable financial value from AI. Yet portfolio company CTOs still show up to quarterly board meetings with presentation decks claiming massive success. The discrepancy comes down to the Vendor Math Trap. Technical leaders report vanity metrics like hours saved or API calls made, creating a false picture of private equity AI ROI. Operating Partners need actual EBITDA impact.
You cannot accept operational activity as a proxy for financial return. To fix this gap between technical execution and the P&L you need a System of Value. SilkFlo replaces manual spreadsheet wrangling with a standardized Forecast vs. Realized loop. It ties AI adoption directly to top-line growth or bottom-line Capacity Released.
The Disconnect Between Tech Metrics and “Bankable” Value
The Vendor Math Trap
Technology vendors grade their own homework. A software provider will claim their Copilot license saves an employee five hours a week. Management assumes this translates directly to cost savings. If that employee simply goes home early or browses the internet, the financial return is zero. We call this the Vendor Math Trap. As the BCG report highlights, the actual algorithms and technology only account for 30 percent of a successful AI transformation. The remaining 70 percent depends entirely on people, organization, and processes. Tracking hours saved is purely a capacity metric. It only becomes a financial metric when you actively reshape the organization to repurpose that capacity or remove it from the payroll.
“Growing into Productivity” vs. Hard Cost-Outs
Value creation in private equity rarely relies on immediate headcount reductions. You usually want to do more with the exact same resources. This is known as growing into productivity. AI initiatives must track against specific bankable outcomes. A successful automation deployment might allow a portfolio company to process 40 percent more service tickets without hiring additional staff. The true value is the avoidance of future hiring costs during a high-growth phase. Value creation teams need a standardized way to track this avoided cost and attribute it to the specific AI deployment.
The Spreadsheet Slog: Why Value Creation Teams Fly Blind

The API Illusion in Messy PortCos
Value creation teams often try to govern digital transformations using disconnected Excel documents. Some ambitious firms try to build automated dashboards requiring direct API connections to portfolio company systems. This is usually an illusion. Mid-market portfolio companies operate with highly fragmented legacy tech stacks. Operating partners waste weeks chasing technical leads for performance data. They end up manually extracting figures from static PDF board decks just to present quarterly updates to their Managing Directors.
Investment Blindness
Manual data collection creates a massive reporting lag. BCG found that private equity faces a unique structural challenge: the standard five-year holding period often conflicts with the timeline of transformative AI investments. You cannot afford to wait two years to see if an initiative works. By the time a private equity firm realizes an AI deployment is failing to impact the P&L, the quarter is over, and the allocated capital is already burned. We call this Investment Blindness. It prevents sponsors from intervening early to fix failing automation programs. Without real-time visibility into project health, funds cannot confidently deploy additional capital into their most promising technology initiatives.
The New Framework for Private Equity AI ROI
Tracking the Top Line (The “Invent” Play)
BCG categorizes the creation of new business models and revenue streams as the Invent play. Operating partners must shift focus toward revenue-generating AI applications like intelligent lead scoring algorithms or generative AI sales agents. The report highlights a financial data provider that built a bespoke GenAI research assistant to reinvent its user experience. This single initiative grew from zero to over $100 million in potential top-line uplift. Another SaaS company deployed an AI client-management process to secure a 53 percent uplift in cross-sell opportunities and an 8 percent ARR bump by month 12. To replicate this the reporting framework must capture hard commercial metrics. Value creation teams need granular visibility into Incremental ARR, Conversion to Close rates and Churn Rate Reduction. These figures must map directly to the specific AI tool driving the change.
Tracking the Bottom Line (The “Reshape” Play)
BCG defines the redesign of core business functions as the Reshape play. This involves extracting costs from bloated operational workflows using automation. The financial impact of reshaping is massive when tracked correctly. BCG points to a leading asset manager that reimagined its customer service operations with GenAI agent assist tools. They achieved a 30 percent cut in OPEX, alongside a 25 percent decrease in average handle time. Similarly, a global logistics company used an AI document analyzer to accelerate RFP responses, resulting in up to 50 percent faster proposal creation and a 10 percent increased win rate. To achieve these results, portfolio companies must report on Capacity Released rather than hours saved. Other critical tracking metrics include Cost Per Asset in marketing workflows or Average Handling Time in customer service environments. These operational improvements must translate into definitive EBITDA figures on the board report.
Factoring in Change Management
It is important to mention that buying the software is the easy part. The BCG report cites data showing that 70 percent of AI value comes from people, organizations and processes while only 20 percent comes from the technology itself. A B2B software company sought to double developer productivity, but captured minimal uplift initially because 50 percent of developers cited concerns with time to learn the new AI coding tools. Value creation teams cannot just deploy licenses. They need to actively monitor tool adoption rates and incentivize behavioral changes across the portfolio to make sure the projected financial value actually materializes.
How SilkFlo Hardwires AI Initiatives to Quarterly EBITDA
Standardizing the Business Case
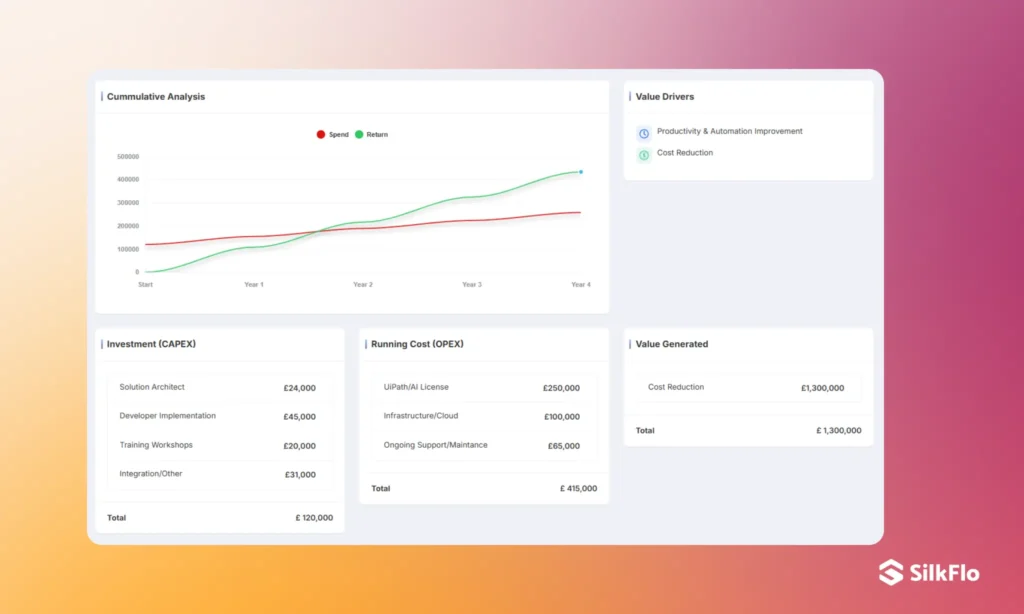
Jira and ServiceNow are Systems of Work designed for technical execution. SilkFlo is the System of Value built to bridge the gap to the P&L. It requires portfolio companies to build a standardized business case before the board approves any funding. This blueprint mandates strict financial visibility. Users must document CapEx alongside OpEx while defining the expected financial value. Every AI project begins with a clear baseline and a strict target for EBITDA impact.
The Forecast vs. Realized Loop
Estimating value is only the first step in the transformation journey. SilkFlo provides a continuous Forecast vs. Realized loop to track ongoing performance. The platform measures the initial estimated value against the actual realized P&L impact month over month. This ensures strict accountability post-deployment. Portfolio company leaders can no longer hide behind projected savings that never materialize in the bank account.
Scaling Success: The Repeatable AI Playbook Catalogue
Operating partners develop deep pattern recognition for successful automation deployments. Once you prove the financial ROI of an AI lead-scoring agent in one portfolio company, you need to scale that success. SilkFlo allows private equity firms to save successful implementations as Solution Blueprints in a centralized catalogue. This codifies the exact implementation costs, execution steps and expected EBITDA uplift. Value creation teams can rapidly deploy these proven AI playbooks across the rest of the fund to accelerate portfolio-wide transformation.
The Portfolio-Wide Aggregation Dashboard
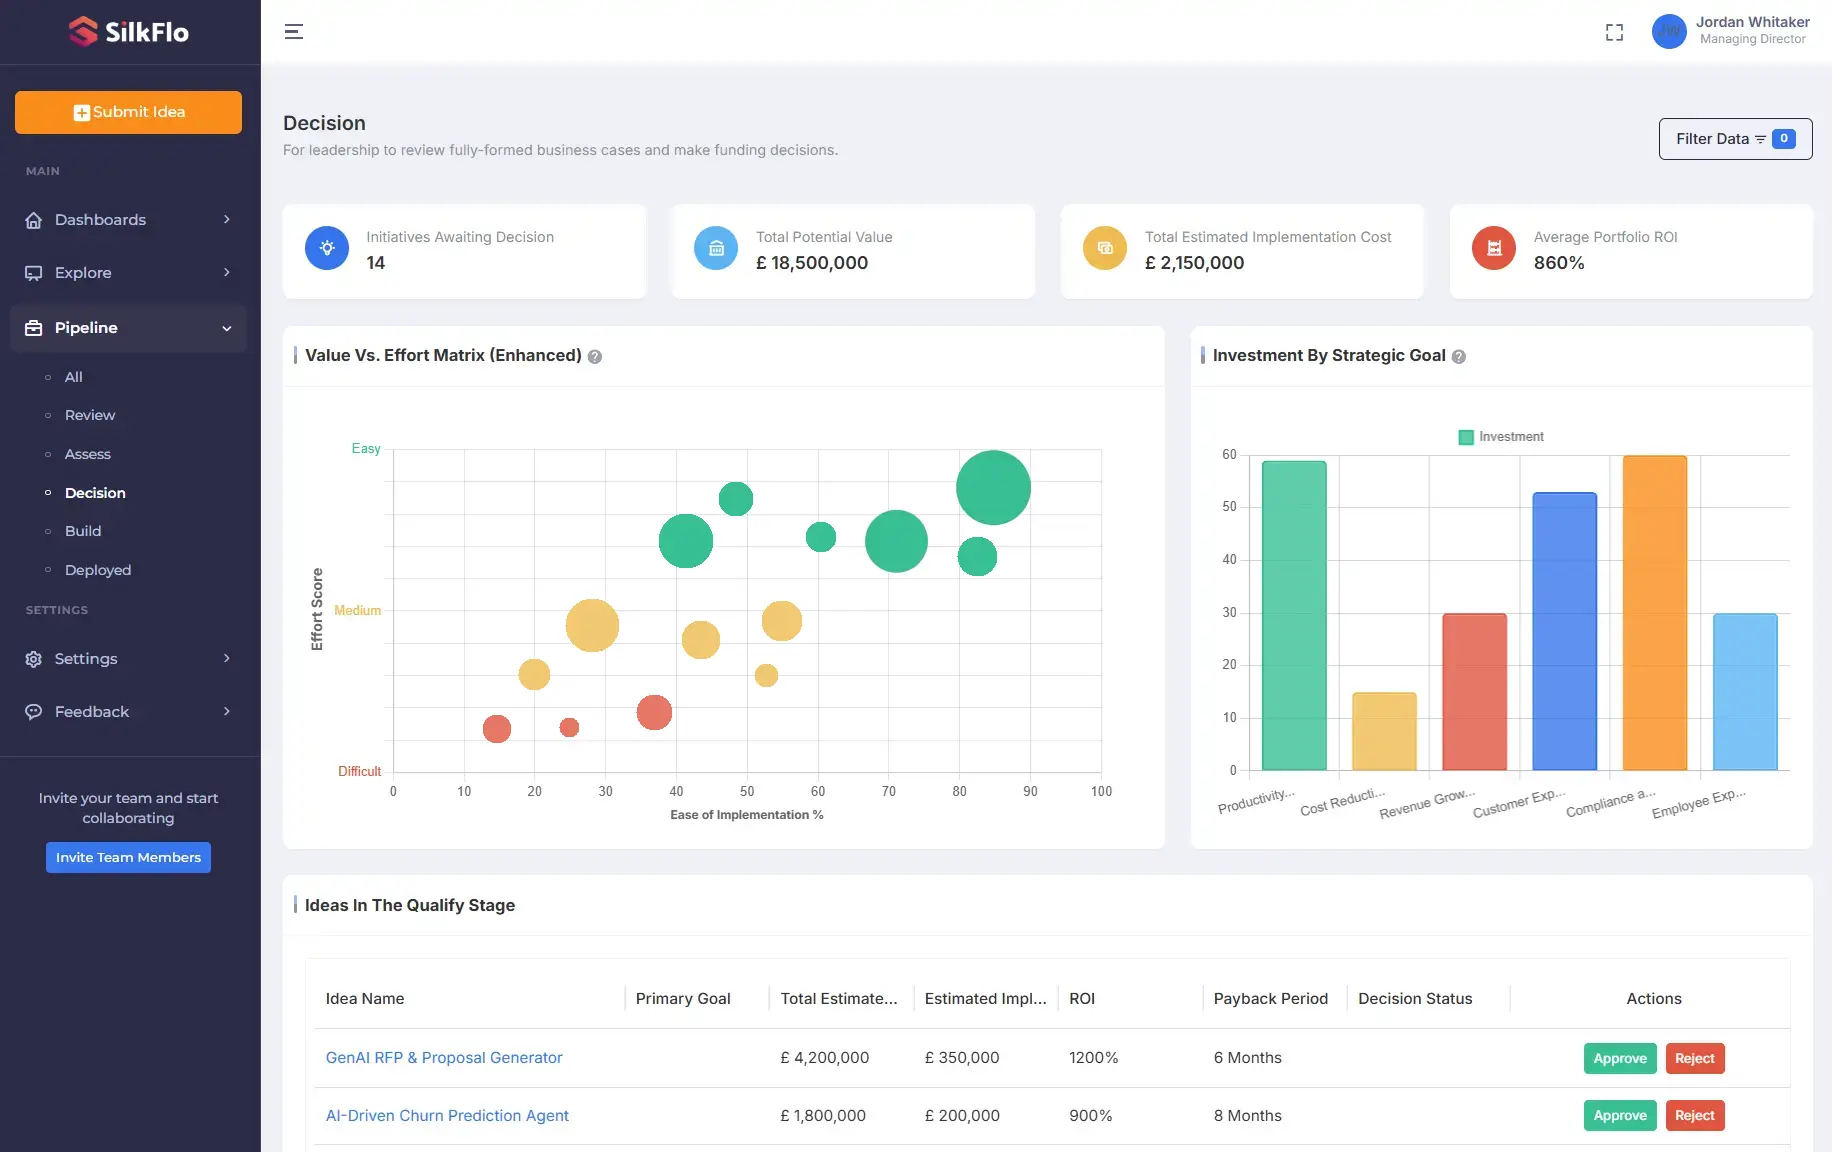
Managing Directors demand a macro view of the fund’s digital transformation progress. SilkFlo rolls up disparate portfolio company data into a single pane of glass. Operating partners can instantly view total incremental value and total EBITDA saved across the entire portfolio. The platform generates a dynamic Value vs. Effort matrix to help leaders prioritize high-impact projects. This aggregated visibility removes the friction of quarterly reporting and provides an agnostic view of the entire technology pipeline.
Build an AI Track Record That Survives Due Diligence
Defending your digital transformation thesis is tough when you only have theoretical “potential” to show future buyers. You need a traceable, auditable track record of realized financial value. Private equity firms cannot achieve premium multiples by selling a spreadsheet full of AI vendor promises.
We will skip the standard software pitch. Instead, we will look at your current value creation playbook, identify where your portfolio companies might be caught in the Vendor Math Trap, and show you exactly how to map your upcoming AI initiatives to hard EBITDA impact.
Whether you are preparing a PortCo for exit in 18 months or just beginning to untangle a messy, cross-portfolio technology pipeline, we will show you how to build a Digital Asset Register that stands up to the strictest financial scrutiny.
Frequently Asked Questions
What is the Vendor Math Trap in AI?
The Vendor Math Trap occurs when companies calculate return on investment using vanity metrics provided by software vendors. Tracking metrics like “hours saved” or “API calls made” creates a false sense of financial success. These are capacity metrics. They only translate to financial ROI when the business actively repurposes that saved time to generate revenue or removes the excess capacity to reduce operating costs.
How do private equity firms track AI ROI across portfolio companies?
Many firms struggle to track ROI because they rely on manual data extraction and fragmented spreadsheets. Leading value creation teams use an Innovation Value Management Platform to aggregate performance data. This provides a centralized system to view the exact financial impact of technology initiatives across every portfolio company in real time.
What is the difference between hours saved and Capacity Released?
Hours saved simply measures the time an employee reclaims by using a faster tool. Capacity Released is a financial metric indicating that the reclaimed time has been converted into tangible business value. This happens when an employee takes on a larger volume of work without requiring additional support staff.
How does SilkFlo help Operating Partners?
SilkFlo gives Operating Partners aggregated visibility into the exact EBITDA impact of every technology initiative across their fund. Instead of starting from scratch with each portfolio company value creation teams use SilkFlo to build a catalogue of repeatable AI playbooks to rapidly scale proven operational wins. Ultimately, this creates a fully auditable track record of realized financial value to help maximize exit multiples during due diligence.